Using Trail Gradient Heatmaps to Avoid Unrideable Sections
You can quickly spot unrideable sections using trail gradient heatmaps that color-code slopes-red and deep orange show 10%+ grades, where gravel bikes and e-bikes often stall, especially over 500 feet of gain. Greens and blues mean easy 5% slopes perfect for endurance riding. Tools like Flattest Route overlay real elevation data, letting you adjust paths with drag-and-drop precision, avoid San Francisco-level climbs, and share safer routes shaped by actual performance feedback. See how gear choices reshape your ride experience next.
We are supported by our audience. When you purchase through links on our site, we may earn an affiliate commission, at no extra cost for you. Learn more. Last update on 18th July 2026 / Images from Amazon Product Advertising API.
Notable Insights
- Trail gradient heatmaps use red and orange colors to highlight unrideable sections with slopes of 10% or more.
- Green and blue segments indicate gentle, rideable slopes under 5%, ideal for efficient biking.
- Overlaid user ride data from platforms like Trailforks reveals real-world trail conditions and steep segments.
- Combine heatmaps with tools like Flattest Route to verify gradients and avoid hidden urban or rural climbs.
- Use drag-and-drop route editing to adjust paths and eliminate steep sections shown in elevation profiles.
How Gradient Heatmaps Reveal Trail Steepness
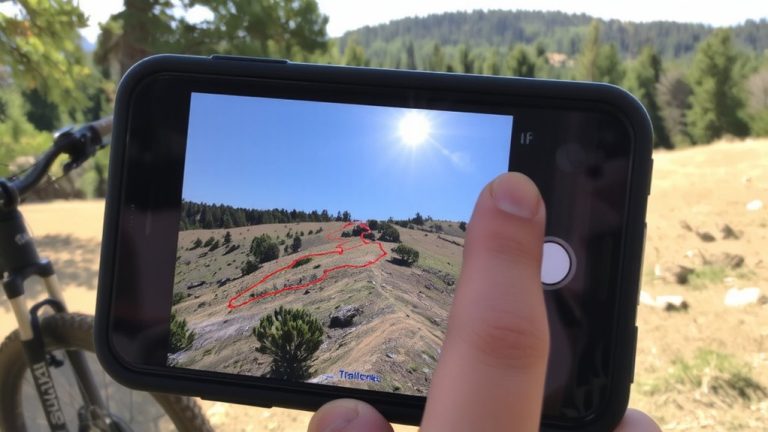
Ever wonder how to instantly spot the steepest sections of a trail before you even start pedaling? A gradient heat map shows you exactly that, using color-coded segments to highlight slope severity. You’ll see red or deep orange where grades hit 10% or more - that’s 10 feet up for every 100 feet forward - warning you about hard climbs. Greens and blues mean gentler terrain, under 5%, ideal for efficient riding. Apps like Trailforks overlay heat maps with real user data, so you’re not just guessing - you’re seeing where riders actually go. These visual cues match elevation graphs from tools like the Flattest Route, which pull slopes directly from Google Maps. Use the heat map legend to judge difficulty, choose the right gear - think wide-range cassettes or trail-running shoes - and plan smoother, smarter rides without surprises.
Spot Unrideable Hills With Color-Coded Slopes
When you’re mapping out a ride, those red and black segments on a gradient heatmap are your first warning that a hill might be unrideable, especially if you’re on a gravel bike with narrow tires or an e-bike with limited assist above 10% grades. These colors highlight slopes of 5% or more-meaning a 5-foot climb for every 100 feet forward-exceeding typical mountain pass averages of 3% to 9%. Steep urban streets or hidden rural climbs often surprise riders, but with ride data from gradient heatmaps, you see trouble before you hit it. Tools like the Flattest Route use Google® Maps elevation data to display slope intensity, so you can adjust your path early. Red and black aren’t just warnings-they’re signals to re-route, especially if your setup isn’t built for extreme inclines. Rely on ride data to stay in the green and yellow, where your tires grip, your legs last, and your ride stays enjoyable.
Build Flatter Routes Using Elevation Profiles
Since steep climbs can quickly sap your energy, especially on a gravel or hybrid bike not built for extreme grades, using elevation profiles to build flatter routes makes a real difference in ride quality and endurance. The Flattest Route tool pulls Google® Maps elevation data to show slope percentages, so you can spot tough grades fast-a 5% incline means a 5-foot rise every 100 feet, which adds up on a long ride. Color-coded roads highlight steep stretches, while the route profile graph displays elevation changes in detail. You’ll need to tweak your path manually by dragging it on the map, comparing profiles to find the smoothest option. Make sure to test alternate corridors, especially in hilly zones like San Francisco. Whether walking, biking, or driving, this tool helps craft manageable routes-just make sure to verify gradients in areas with rapid elevation swings.
Avoid Dangerous Climbs for Safer Rides
How do you know when a hill’s too steep to ride safely? Trail gradient heatmaps show color-coded segments-blue, red, and black mark severe inclines over 10%, perfect to avoid. In places like San Francisco, roads often exceed 15%, far steeper than standard highways at 3%–9%. Using the Flattest Route tool with Google® Maps elevation data, you can generate slope profiles and spot risky climbs before you ride. Drag-and-drop lets you tweak routes, comparing elevation changes to pick safer, flatter paths. These visuals make it easy to dodge unrideable grades that could strain your bike or body. And when you find a smart, safe route, share it on social media to help others skip the struggle. Gradient legends rate difficulty so you’re never surprised. Ride smarter, stay in control, and keep your adventures safe with tools that put real data where you need it-on your screen, before you roll.
On a final note
You can spot trouble before you hit it, and that’s where trail gradient heatmaps shine. Red zones flag 15%+ climbs-too steep for most riders, especially on a loaded gravel bike like the Salsa Cowgirl 2. Use apps with elevation profiles to reroute around them, aiming for slopes under 10%. Pair this with a SRAM XPLR 10-44T cassette for easier spinning, and your legs will thank you on long backpacking-cycling tours.